OTIM-DB linear fit in log-space
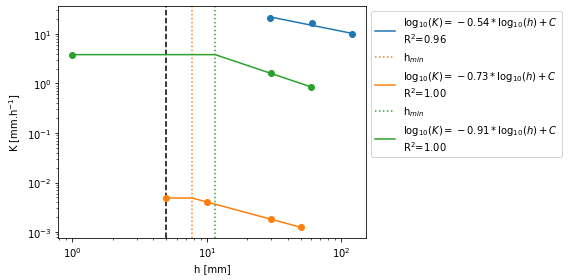
We fit a linear relationship in log space between the tension (h positive in mm) and the unsaturated hydraulic conductivity (K in mm.h-1). We use K with tension < 5 mm (included Ks) to compute a plateau. The other values are used to compute a linear fit in loglog space.
- If there are more than 3 data points, we remove the one at the lowest tension (closer to saturation) if below 0.5 cm and use it afterwards to compute the Hmin. If it's tension is above 0.5 mm then we keep it in the fit.
- If the slope and the K10 (K at 10 cm tension) is already given, then we use them to compute the intercept with Kunsat at 10 cm
In all cases, we use the intercept and the slope to compute tensions at 1, 2, 3, 4, 5, 6, 7, 8, 9, 10 cm if they are in the interval between Tmin and Tmax both included. If Tmax >= 8 cm, we extrapolate up to h = 10 cm.
Nick's rules:
- no estimation of Ks unless there is a data point at h<=5 mm
- no estimation of K10 unless there is a data point at h>= 80 mm
import numpy as np
import pandas as pd
import matplotlib.pyplot as plt
from scipy import stats

datadir = '../data/'
figdir = '../figures/'
# read in Kunsat database
dfdic = pd.read_excel(datadir + 'OTIM-DB.xlsx', sheet_name=None)
dfmtf = pd.merge(dfdic['method'], dfdic['modelFit'], left_on='MethodName', right_on='MTFName')
# don't replace as it makes empty cells on export then or merged cell -> a mess!
dfraw = dfdic['rawData']/home/jkl/.local/lib/python3.9/site-packages/openpyxl/worksheet/_reader.py:312: UserWarning: Unknown extension is not supported and will be removed
warn(msg)
/home/jkl/.local/lib/python3.9/site-packages/openpyxl/worksheet/_reader.py:312: UserWarning: Conditional Formatting extension is not supported and will be removed
warn(msg)
# all tensions as positive number
print('number of negative tensions:', dfraw['h (cm)'].lt(0).sum())
dfraw['h (cm)'] = dfraw['h (cm)'].abs()
number of negative tensions: 0
# fit linear relationship in loglog space for raw data
tensions = np.arange(1, 11)*10  # mm
kcols = ['k{:.0f}'.format(t/10) for t in tensions]
logdic = {'not enough h > 5 mm': [], 'hmin < max(h of plateau)': [], 'fit failed': [],
          'only one tension': [], 'kunsat unknown for old entries': []}
#for i, mtfName in enumerate(dfmtf[dfmtf['MTFName'].str.contains('lopes2020')]['MTFName']):
for i, mtfName in enumerate(dfmtf['MTFName']):
    # we have raw data so let's fit a relationship
    ie = dfraw['MTFName'] == mtfName
    ok = False
    oo = False

    # we need at least two values to fit a line
    if np.sum(ie) > 1:
        ok = True
        kunsat = dfraw[ie]['K (mm.h-1)'].values
        h = dfraw[ie]['h (cm)'].values*10  # mm
        isort = np.argsort(h)

        # if Ksat is available we keep and set it to a very small tension
        if h[isort][0] == 0:
            h[isort[0]] = 1  # a very small tension for Ks

        # values are sorted from lowest 0 cm to highest tension 10 cm
        x = h[isort]
        y = kunsat[isort]

        # we compute a plateau (and Ks) if we have tension(s) <= 5 mm
        hplateau = 5
        iplateau = x <= hplateau
        if np.sum(iplateau) > 0:
            ksat = np.mean(y[iplateau])
        else:
            ksat = None

        # extend the plateau if the next tension is greater than extimated ksat (e.g. Bodner2013)
#         if ksat is not None:
#             if y[~iplateau][0] > np.min(y[iplateau]):
#                 print('+++', mtfName, x[iplateau], x[x > hplateau])
#                 hplateau = h[~iplateau][0]
#                 iplateau = x <= hplateau
#                 ksat = np.mean(y[iplateau])
#                 oo = True

        # linear fit in log-log space
        # we do not include 5 mm for the fit
        ifit = x > hplateau
        if np.sum(ifit) < 2:  # then we take them all even Ks (e.g. holden2014)
            ifit = np.ones(len(x), dtype=bool)
            logdic['not enough h > 5 mm'].append(mtfName)
        slope, intercept, r, p, se = stats.linregress(
            np.log10(x[ifit]), np.log10(y[ifit]))
        #print(x[ifit], x[iplateau])

        # with the plateau (Ksat) and the fit we compute Hmin
        if np.sum(iplateau) > 0:
            hmin = 10**((np.log10(ksat) - intercept)/slope)
            if hmin < np.max(x[iplateau]):  # this is wrong (e.g. lozano2014)
                hmin = None
                slope, intercept, r, p, se = stats.linregress(
                    np.log10(x), np.log10(y))
                logdic['hmin < max(h of plateau)'].append(mtfName)
        else:
            hmin = None

        # check if the fit failed
        if pd.isna(intercept):
            logdic['fit failed'].append((mtfName, x, y))

    # if there is no rawData, this is an old entry
    # we compute back the intercept from kunsat (k at 10 cm tension)
    elif np.sum(ie) == 0:
        ok = True
        if pd.isna(dfmtf.loc[i, 'Kunsat']) is False:
            k10 = dfmtf.loc[i, 'Kunsat']
            # slope is reported as positive number in the db
            slope = - dfmtf.loc[i, 'slope']
            intercept = np.log10(k10) - slope * np.log10(100)
            dfmtf.loc[i, 'intercept'] = intercept
            hmin = dfmtf.loc[i, 'Hmin']
            ksat = dfmtf.loc[i, 'Ks'] if dfmtf.loc[i, 'Tmin'] <= 5 else None
        else:
            slope, intercept = np.nan, np.nan
            logdic['kunsat unknown for old entries'].append(mtfName)

    else:
        logdic['only one tension'].append(mtfName)

    if ok is True:
        # build fpred() function
        def fpred(hh):
            if pd.isna(hmin) is False:
                if hh <= hmin:
                    return ksat
                else:
                    return 10**(intercept + slope * np.log10(hh))
            else:
                return 10**(intercept + slope * np.log10(hh))

        # estimate K for other tensions between Tmin and Tmax
        Tmin = dfmtf.loc[i, 'Tmin']  # mm
        Tmax = dfmtf.loc[i, 'Tmax']
        if Tmax >= 80:  # allow extrapolation if Tmax is 80 mm or more
            Tmax = 100
        kvals = [np.nan]*len(tensions)
        for j, tension in enumerate(tensions):
            if (tension >= Tmin) & (tension <= Tmax):
                kvals[j] = fpred(tension)
        dfmtf.loc[i, kcols] = kvals
        dfmtf.loc[i, 'Ks'] = ksat  # overwrite Ks with NaN if Tmin > 5 mm

        # only for new entries
        if np.sum(ie) > 0:
            # save them into the database
            dfmtf.loc[i, ['Ks', 'Kunsat', 'slope', 'intercept', 'R2', 'Hmin']] = [
                ksat, None, slope*-1, intercept, r**2, hmin]

            if False:  # change to False to prevent plotting
                fig, ax = plt.subplots()
                ax.set_title(mtfName)
                ax.loglog(x, y, 'ko')
                if x[0] == 0.1:
                    ax.loglog(x[0], y[0], 'ro', label='Ks')
                ax.set_xlabel('h [mm]')
                ax.set_ylabel(r'K [mm.h$^{-1}$]')
                if hmin is not None:
                    ax.axvline(hmin, linestyle=':', color='k', label='Hmin')
                    xx = np.sort(np.r_[x, hmin])
                else:
                    xx = x
                ax.loglog(xx, [fpred(a) for a in xx], 'k-',
                          label='Slope: {:.2f}\nR$^2$={:.2f}'.format(slope, r**2))
                ax.legend()
                plt.show()

dfmtf.to_excel(datadir + 'dfmtf.xlsx', index=False)
logdic
{'not enough h > 5 mm': ['holden2014_B2',
'holden2014_B4',
'holden2014_B15+',
'holden2014_W',
'holden2014_U',
'zhao2014_dry_cropland',
'zhao2014_dry_acl1',
'zhao2014_dry_acl5',
'zhao2014_dry_acl9',
'zhao2014_dry_acl16',
'zhao2014_dry_grassland'],
'hmin < max(h of plateau)': ['Bodner2013sep2009',
'Bodner2013dec2009',
'Bodner2013apr2010',
'Bodner2013jul2012',
'holden2014_W',
'hallam2020_BSE_control_spring2017',
'hallam2020_BSW_control_summer2017',
'hallam2020_BSW_DeF_autumn2017',
'Soracco2019_CHA_CT',
'Wanniarachchi2019_1N_DM2',
'zhao2014_dry_cropland',
'zhao2014_dry_grassland',
'lopes2020_SFE',
'lopes2020_EP'],
'fit failed': [],
'only one tension': ['kuhwald2017CT_traffic_mai2015',
'kuhwald2017RT1_traffic_mai2015',
'kuhwald2017RT2_traffic_mai2015',
'kuhwald2017CT_traffic_aug2015',
'kuhwald2017RT1_traffic_aug2015',
'kuhwald2017RT2_traffic_aug2015',
'kuhwald2017CT_untraffic_mai2015',
'kuhwald2017RT1_untraffic_mai2015',
'kuhwald2017RT2_untraffic_mai2015',
'kuhwald2017CT_untraffic_aug2015',
'kuhwald2017RT1_untraffic_aug2015',
'kuhwald2017RT2_untraffic_aug2015'],
'kunsat unknown for old entries': []}# example for the data in brief paper
fig, ax = plt.subplots(figsize=(8, 4))
ax.axvline(5, color='k', linestyle='--')
tensions = np.arange(1, 11)*10 # mm
kcols = ['k{:.0f}'.format(t/10) for t in tensions]
logdic = {'not enough h > 5 mm': [], 'hmin < max(h of plateau)': [], 'fit failed': [],
'only one tension': [], 'kunsat unknown for old entries': []}
spub = ['Rahbeh2019_S56', 'zhao2014_wet_acl16', 'deboever2016_Canopy_MCD']
for i, mtfName in enumerate(dfmtf[dfmtf['MTFName'].isin(spub)]['MTFName']):
# we have raw data so let's fit a relationship
ie = dfraw['MTFName'] == mtfName
ok = False
oo = False
# we need at least two values to fit a line
if np.sum(ie) > 1:
ok = True
kunsat = dfraw[ie]['K (mm.h-1)'].values
h = dfraw[ie]['h (cm)'].values*10 # mm
isort = np.argsort(h)
# if Ksat is available we keep and set it to a very small tension
if h[isort][0] == 0:
h[isort[0]] = 1 # a very small tension for Ks
# values are sorted from lowest 0 cm to highest tension 10 cm
x = h[isort]
y = kunsat[isort]
# we compute a plateau (and Ks) if we have tension(s) <= 5 mm
hplateau = 5
iplateau = x <= hplateau
if np.sum(iplateau) > 0:
ksat = np.mean(y[iplateau])
else:
ksat = None
# extend the plateau if the next tension is greater than extimated ksat (e.g. Bodner2013)
# if ksat is not None:
# if y[~iplateau][0] > np.min(y[iplateau]):
# print('+++', mtfName, x[iplateau], x[x > hplateau])
# hplateau = h[~iplateau][0]
# iplateau = x <= hplateau
# ksat = np.mean(y[iplateau])
# oo = True
# linear fit in log-log space
# we do not include 5 mm for the fit
ifit = x > hplateau
if np.sum(ifit) < 2: # then we take them all even Ks (e.g. holden2014)
ifit = np.ones(len(x), dtype=bool)
logdic['not enough h > 5 mm'].append(mtfName)
slope, intercept, r, p, se = stats.linregress(
np.log10(x[ifit]), np.log10(y[ifit]))
print(x[ifit], x[iplateau])
# with the plateau (Ksat) and the fit we compute Hmin
if np.sum(iplateau) > 0:
hmin = 10**((np.log10(ksat) - intercept)/slope)
if hmin < np.max(x[iplateau]): # this is wrong (e.g. lozano2014)
hmin = None
slope, intercept, r, p, se = stats.linregress(
np.log10(x), np.log10(y))
logdic['hmin < max(h of plateau)'].append(mtfName)
else:
hmin = None
# check if the fit failed
if pd.isna(intercept):
logdic['fit failed'].append((mtfName, x, y))
# if there is no rawData, this is an old entry
# we compute back the intercept from kunsat (k at 10 cm tension)
elif np.sum(ie) == 0:
ok = True
if pd.isna(dfmtf.loc[i, 'Kunsat']) is False:
k10 = dfmtf.loc[i, 'Kunsat']
# slope is reported as positive number in the db
slope = - dfmtf.loc[i, 'slope']
intercept = np.log10(k10) - slope * np.log10(100)
dfmtf.loc[i, 'intercept'] = intercept
hmin = dfmtf.loc[i, 'Hmin']
ksat = dfmtf.loc[i, 'Ks']
else:
slope, intercept = np.nan, np.nan
logdic['kunsat unknown for old entries'].append(mtfName)
else:
logdic['only one tension'].append(mtfName)
if ok is True:
# build fpred() function
def fpred(hh):
if pd.isna(hmin) is False:
if hh <= hmin:
return ksat
else:
return 10**(intercept + slope * np.log10(hh))
else:
return 10**(intercept + slope * np.log10(hh))
# estimate K for other tensions between Tmin and Tmax
Tmin = dfmtf.loc[i, 'Tmin'] # mm
Tmax = dfmtf.loc[i, 'Tmax']
if Tmax >= 80: # allow extrapolation if Tmax is 80 mm or more
Tmax = 100
kvals = [np.nan]*len(tensions)
for j, tension in enumerate(tensions):
if (tension >= Tmin) & (tension <= Tmax):
kvals[j] = fpred(tension)
dfmtf.loc[i, kcols] = kvals
# only for new entries
if np.sum(ie) > 0:
# save them into the database
dfmtf.loc[i, ['Ks', 'slope', 'intercept', 'R2', 'Hmin']] = [ksat, slope*-1, intercept, r**2, hmin]
cax, = ax.loglog(x, y, 'o')
color = cax.get_color()
if x[0] == 0.1:
ax.loglog(x[0], y[0], 'ro', label='Ks')
ax.set_xlabel('h [mm]')
ax.set_ylabel(r'K [mm.h$^{-1}$]')
if hmin is not None:
ax.axvline(hmin, linestyle=':', label='h$_{min}$', color=color)
xx = np.sort(np.r_[x, hmin])
else:
xx = x
ax.loglog(xx, [fpred(a) for a in xx], '-', color=color,
label='$\log_{{10}}(K) = {:.2f}*\log_{{10}}(h) + C$'.format(slope) + '\nR$^2$={:.2f}'.format(r**2))
ax.legend(bbox_to_anchor=(1, 1))
fig.tight_layout()
fig.savefig(figdir + 'fit.jpg', dpi=500)[ 29.57177018 60.16325657 120.3265131 ] []
[10. 30. 50.] [5.]
[30. 60.] [1.]