Natural language processing on primary studies selected from meta-analyses
This notebook explore natural language processing (NLP) techniques on the corpus of primary studies selected in the review of meta-analyses. It will explore:
- topic modelling
- relationship extraction
NOTE: this notebook needs the full-text papers to run. For copyright reasons, these are not provided with the notebooks.
import numpy as np
import matplotlib.pyplot as plt
import matplotlib.patches as mpatches
import pandas as pd
import time
import os
import shutil
import re
from tqdm.notebook import tqdm_notebook as tqdm
from lxml import etree, html
import requests
import requests_cache
import spacy
from spacy.matcher import Matcher, PhraseMatcher
from spacy import displacy
import json
from pprint import pprint
import networkx as nx # drawing network graph
import unicodedata
from io import StringIO
from scipy import stats
nlp = spacy.load("en_core_web_sm")
import warnings
warnings.simplefilter('ignore')

datadir = '../data/from-meta/'
outputdir = datadir + '../../figures/'

dfscore = pd.DataFrame(columns={'step', 'n', 'recall', 'precision', 'f1', 'match'})

def camelCase(x):
    return x.lower()[0] + x.title().replace(' ','')[1:]
# gensim imports
import nltk
from nltk.tokenize import RegexpTokenizer
from nltk.stem.wordnet import WordNetLemmatizer
from nltk.corpus import stopwords
import gensim
from gensim.models import Phrases
from gensim.models import LdaModel, LdaMulticore
from gensim.corpora import Dictionary
from gensim import models
from gensim import similarities
import pyLDAvis
from pyLDAvis import gensim_models as gensimvisprint('spacy', spacy.__version__)
print('gensim', gensim.__version__)
print('nltk', nltk.__version__)
print('pyLDAvis', pyLDAvis.__version__)spacy 3.1.1
gensim 4.0.1
nltk 3.6.1
pyLDAvis 3.3.1
Preparing publications
# some statistics (start here)
dfpub = pd.read_csv(datadir + 'fromMeta.csv')
print('total entries:', dfpub.shape[0])
print('with doi:', dfpub['DOI'].notnull().sum())
print('retrieved:', dfpub['retrieved'].sum())
# we will only work with the ones which have full-text
dfpub = dfpub[dfpub['retrieved']].reset_index(drop=True)
total entries: 1964
with doi: 1964
retrieved: 1469
# creating rawdocs and extract text
rawdocs = []
c = 0
for fname in dfpub['fname']:
    # convert to text (only need to do it once)
    #os.system('pdftotext "' + datadir + 'papers/' + fname + '.pdf"')
    fpath = datadir + 'papers/' + fname + '.txt'
    if os.path.exists(fpath):
        with open(fpath, 'r', encoding='utf8') as f:
            try:
                text = f.read()
                if len(text) > 100:
                    rawdocs.append(text)
                else:
                    print('document too small', fname)
                c += 1
            except:
                print('error with', fname)
                rawdocs.append('')
    else:
        print('path not found for', fname, fpath) # pdf are empty
        rawdocs.append('')
print('imported:', c, '/', dfpub.shape[0])
imported: 1469 / 1469
Detecting abstract, references sections
Abstract is detected based on rules (specific keywords identfied, paragraph identified). The references section is also identified. Both abstract and references are removed from the main document, rawdocs is overwritten.
# detect abstract, keywords, reference, title - overwrite rawdocs!
abstracts = []
rawdocs = []
df = pd.DataFrame(columns=['fname', 'start', 'end', 'length', 'code'])
dfpub['abstract'] = pd.NA
for i, fname in tqdm(enumerate(dfpub.loc[:, 'fname']), total=dfpub.shape[0]):
    fpath = datadir + 'papers/' + str(fname) + '.txt'
    code = ''  # determine how the abstract was found
    if (pd.isna(fname) is False) & (os.path.exists(fpath)):
        with open(fpath, 'r', encoding='utf8') as f:
            doc = f.read()
        splitdoc = re.split('a b s t r a c t|abstract|ABSTRACT|Abstract|A B S T R A C T|Summary|s u m m a r y|SUMMARY', doc)
        foundStart = True
        if len(splitdoc) == 1:
            foundStart = False
        if len(' '.join(splitdoc[1:])) > 50:
            text = '\n'.join(splitdoc[1:]) if len(splitdoc) > 1 else splitdoc[0] # if not keyword abstract found, take all
        else:
            #print('take it all for', fname)
            text = doc

        # assuming first paragraph is the abstract
        splitEnd = re.split('Published|Introduction|Copyright|©|Keywords|keywords|KEYWORDS|KEY WORDS|Citation', text)
        foundEnd = True
        if len(splitEnd) == 1:
            foundEnd = False
            #print('abstract end not found', fname)
            paragraphs = text.split('\n\n')
            ps = []
            a = ''
            # we only want paragraphs split that are more than 10 characters
            for p in paragraphs:
                a = a + '\n\n' + p
                if len(a) > 10:
                    ps.append(a)
                    a = ''
            if foundStart is True:
                abstract = ps[0]
                code = 'ps[0]'
            else:
                # without detection of the start or end, we
                # blindly assume that abstract is first paragraph
                abstract = ps[1]
                code = 'first'
                #print('abstract = first paragraph', fname)
        else:
            abstract = ''
            for j, s in enumerate(splitEnd):
                if len(s) > 50 and abstract == '':
                    abstract = s
                    code = 's{:d}'.format(j)

        # cleaning up the abstract
        if abstract[0] in [':', '.']:
            abstract = abstract[1:]
        abstract = abstract.strip()

        # edge case (if we have two first large paragraphs)
        ts = abstract.split('\n\n')
        if len(ts) > 1:
            if (len(ts[0]) > 800) & (len(ts[1]) > 800):
                if ts[0][0] in 'ABCDEFGHIJKLMNOPQRSTUVWXYZ':
                    abstract = ts[0]
                    #print(fname, 'first')
                    code = 'ts[0]'
                else:
                    abstract = ts[1]
                    #print(fname, 'second')
                    code = 'ts[1]'

        # write down abstract for manual assessment
        with open(fpath.replace('.txt', '-abstract.txt'), 'w', encoding='utf8') as f:
            f.write(abstract)
        df = df.append({'fname': fname, 'start': foundStart, 'end':
                        foundEnd, 'length': len(abstract), 'code': code},
                       ignore_index=True)

        # add the abstract to dfpub
        dfpub.loc[i, 'abstract'] = abstract

        # remove the abstract from the body
        body = text.replace(abstract, '')

        # remove the references
        #if len(re.findall('r(é|e)f(é|e)rences?|r ?e ?f ?e ?r ?e ?n ?c ?e ?s?', body, flags=re.IGNORECASE)) == 0:
        #    print('no ref found for', fname)
        parts = re.split('\n\s?r(é|e)f(é|e)rences?\n|\n\s?r ?e ?f ?e ?r ?e ?n ?c ?e ?s?\n', body, flags=re.IGNORECASE)
        if len(parts) > 2:  # at least one 'reference' found
            body = '\nReferences\n'.join([a for a in parts[:-1] if a is not None])
        else:
            body = body
            #print('ref not found for', dfpub.loc[i, 'fname'])
            # for old papers with no ref section parsed to OCR, that's often the case
        # failsafe for badly detected abstract
        ratio = len(body) / len(text)
        if ratio < 0.6:
            #print('abstract probably not well detected for', fname, '(ratio: {:.2f})'.format(ratio))
            body = text
        rawdocs.append(body)
    else:
        print(fpath, 'not found')
print('number of abstract detected:', dfpub['abstract'].notnull().sum(), '/', dfpub.shape[0])Parsing abstract from webpages
This approach is a bit more reliable than the pdf to text conversion because most of the strange symbols are kept in. Also when the pdf has two or more columns, it can happen that the abstract is not the first paragraph but rather the second.
# getting html page (run this once)
# from selenium import webdriver
# driver = webdriver.Firefox()
# for i in tqdm(range(0, dfpub.shape[0])):
#     doi = dfpub.loc[i, 'DOI']
#     fname = dfpub.loc[i, 'fname']
#     if (pd.isna(fname) is False) & (pd.isna(doi) is False):
#         # open each doi in a new tab
#         #webbrowser.open('https://doi.org/' + doi.strip())
#         # requests is not enough to get proper rediction, better use selenium
#         driver.get('http://doi.org/' + doi)
#         time.sleep(2)  # wait a bit for the page to be fully loaded
#         with open(datadir + 'webpages/' + fname + '.html', 'w', encoding='utf8') as f:
#             f.write(driver.page_source)
# driver.close()
# parsing html publication to extract abstract
abstracts = []
for i in tqdm(range(0, dfpub.shape[0])):
doi = dfpub.loc[i, 'DOI']
fname = dfpub.loc[i, 'fname']
fpath = datadir + 'webpages/{:s}.html'.format(fname)
if (pd.isna(fname) is False) & (pd.isna(doi) is False) & (os.path.exists(fpath)):
#print(i, fname, 'https://doi.org/' + doi, end='')
with open(fpath, 'r', encoding='utf8') as f:
tree = html.parse(StringIO(f.read()))
try:
# parsing abstract
htitle = tree.xpath("//h1[text()='Abstract'] | "
"//h2[text()='Abstract'] | "
"//h3[text()='Abstract'] | "
"//h4[text()='Abstract'] | "
"//h1[text()='ABSTRACT'] | "
"//h2[text()='ABSTRACT'] | "
"//h3[text()='ABSTRACT'] | "
"//h4[text()='ABSTRACT'] | "
"//h1[text()='Summary'] | "
"//h2[text()='Summary'] | "
"//h3[text()='Summary'] | "
"//h4[text()='Summary'] | "
"//h1[text()='Abstracts'] | "
"//h2[text()='Abstracts'] | "
"//h3[text()='Abstracts'] | "
"//h4[text()='Abstracts'] | "
"//strong[text()='Abstract.']"
)
parent = None
if len(htitle) > 0:
parent = htitle[0].getparent()
#print(' -> found', parent.tag)
else:
# try to find the p or div with the longest text
c = 0
for p in tree.xpath('//p'):
# detect only the text at first level, not nested
pt = ' '.join(p.xpath('.//text()[normalize-space()]'))
if len(pt) > c:
parent = p
c = len(pt)
# the following is matching too many div
for div in tree.xpath('//div'):
divt = ' '.join(div.xpath('./text()[normalize-space()]'))
if len(divt) > c and len(divt) < 2000:
parent = div
c = len(divt)
#print(' -> inferred', parent.tag)#, parent, parent.attrib, c)
xpath = './/text() | .//div/text() | .//div/p/text() | .//p/text() |' \
'.//div/i/text() | .//div/p/i/text() | .//p/i/text() |' \
'.//div/b/text() | .//div/p/b/text() | .//p/b/text() |' \
'.//div/sup/text() | .//div/p/sup/text() | .//p/sup/text() |' \
'.//div/sub/text() | .//div/p/sub/text() | .//p/sub/text() |' \
'.//div/emph/text() | .//div/p/emph/text() | .//p/emph/text() |' \
'.//div/span/text() | .//div/p/span/text() | .//p/span/text() |' \
'.//div/span/span/text() | .//div/p/span/span/text() | .//p/span/span/text() |' \
'.//div/span/span/span/text() | .//div/p/span/span/span/text() | .//p/span/span/span/text() |' \
'.//div/span/span/a/text() | .//div/p/span/span/a/text() | .//p/span/span/a/text() |' \
'.//div/span/a/text() | .//div/p/span/a/text() | .//p/span/a/text() |' \
'.//div/em/text() | .//div/p/em/text() | .//p/em/text()'
if parent is not None:
#print(parent, parent.attrib)
elms = parent.xpath(xpath)
if len(' '.join(elms)) < 100:
gparent = parent.getparent()
#print('going for grandparents', gparent, gparent.attrib)
#print([(a, a.attrib) for a in gparent.xpath('.//div')])
elms = gparent.xpath('.//div')[1].xpath(xpath)
abstract = ' '.join(elms)
else:
# try to find the p or div with the longest text
abstract = ''
for p in tree.xpath('//p'):
if len(p) > len(abstract):
abstract = p
for div in tree.xpath('//div'):
if len(div) > len(abstract):
print(div.getparent())
abstract = div
if abstract == '':
#print(' -> not found')
pass
else:
pass
#print(' -> long p found')
# cleaning up
abstract = abstract.strip()
abstract = re.sub('Abstracts?\.?[ \n\t]+', '', abstract)
abstract = re.sub('ABSTRACTS?\.?[ \n\t]+', '', abstract)
abstract = re.sub('Summary\.?[ \n\t]+', '', abstract)
abstract = abstract.split('Keywords')[0]
abstract = abstract.split('Key words')[0]
abstract = abstract.split('Copyright')[0]
abstract = abstract.split('©')[0]
if len(re.split('\n\s+\n', abstract)) < 3:
a = re.split('\n\s+\n', abstract)[0]
if len(a) > 200:
abstract = a
abstract = re.sub('[ \t\n]{2,}', '', abstract)
abstract = abstract.strip()
abstract = unicodedata.normalize("NFKD", abstract)
#print('\n' + abstract + '\n')
abstracts.append(abstract)
dfpub.loc[i, 'abstract-web'] = abstract
except Exception as e:
print('-> FAILED with error' + str(e))
print('{:d}/{:d} abstracts found'.format(dfpub['abstract-web'].notnull().sum(), dfpub.shape[0]))Topic classifcations with gensim
useful links:
- LDAvis paper https://nlp.stanford.edu/events/illvi2014/papers/sievert-illvi2014.pdf
- https://nlpforhackers.io/topic-modeling/
Coherence used is C coherence of Röder et al. (2015).
# Tokenize the documents.
docs = []
# Split the documents into tokens.
tokenizer = RegexpTokenizer(r'\w+')
for doc in rawdocs:
    docs.append(tokenizer.tokenize(doc.lower()))

# Remove numbers, but not words that contain numbers.
docs = [[token for token in doc if not token.isnumeric()] for doc in docs]

# Remove words that are only 3 characters.
docs = [[token for token in doc if len(token) > 3] for doc in docs]

# Remove Stop Words
stop_words = stopwords.words('english')
docs = [[word for word in doc if word not in stop_words] for doc in docs]

# Lemmatize the documents.
lemmatizer = WordNetLemmatizer()
docs = [[lemmatizer.lemmatize(token) for token in doc] for doc in docs]

# Add bigrams and trigrams to docs (only ones that appear 20 times or more).
# if 'soil' is followed by 'moisture' more than 20 times 'soil moisture' will be a bigram
bigram = Phrases(docs, min_count=20)
docs2 = []
for idx in range(len(docs)):
    tmp = []
    for token in bigram[docs[idx]]:
        if '_' in token:
            # Token is a bigram, add to document.
            docs[idx].append(token)
            tmp.append(token)
    docs2.append(tmp)

# overwrite docs with docs2 (only contains bigrams)
docs = docs2

# filter unrelevant words

# reate a dictionary representation of the documents.
dictionary = Dictionary(docs)

# filter out words that occur in less than 20 documents, or more than 50% of the documents.
dictionary.filter_extremes(no_below=20, no_above=0.5)

# bag-of-words (bow) representation of the documents
# e.g. this word appears 5 times in the first document
corpus = [dictionary.doc2bow(doc) for doc in docs]

print('Number of unique tokens: {:d}'.format(len(dictionary)))
print('Number of documents: {:d}'.format(len(corpus)))
Number of unique tokens: 2357
Number of documents: 1469
# Train LDA model (Latent Dirichlet Analysis)

num_topics = 6

# Make a index to word dictionary.
temp = dictionary[0]  # This is only to "load" the dictionary.
id2word = dictionary.id2token

# create the model
model = LdaModel(
    #workers=4,
    corpus=corpus,
    id2word=dictionary,
    #chunksize=1000,
    #alpha='auto',
    #eta='auto',
    #iterations=100,
    num_topics=num_topics,
    #passes=10,
    #eval_every=None  # don't evaluate model perplexity, takes too much time.
)

# train the model with the selected coherence metrics and keep the top N words
t0 = time.time()
#top_topics = model.top_topics(corpus, coherence='u_mass', topn=5)
top_topics = model.top_topics(texts=docs, coherence='c_v', dictionary=dictionary, topn=6)
print('elapsed: {:.2f}s'.format(time.time() - t0))

# average topic coherence is the sum of topic coherences of all topics, divided by the number of topics.
avg_topic_coherence = sum([t[1] for t in top_topics]) / num_topics
print('Average topic coherence: %.4f.' % avg_topic_coherence)

# probability of a word belonging to a topic
# model.get_term_topics('cover_crop')

# bow_list =['cover_crop', 'water_content']
# # convert to bag of words format first
# bow = model.id2word.doc2bow(bow_list)

# # interpreting the data
# doc_topics, word_topics, phi_values = model.get_document_topics(bow, per_word_topics = True)

pprint(top_topics)
elapsed: 9.67s
Average topic coherence: 0.4629.
[([(0.022423595, 'crop_residue'),
(0.017042536, 'cropping_system'),
(0.015680043, 'cover_crop'),
(0.013967869, 'crop_rotation'),
(0.009307228, 'microbial_biomass'),
(0.009229824, 'winter_wheat')],
0.5819526761463872),
([(0.040916074, 'cover_crop'),
(0.01711834, 'conventional_tillage'),
(0.01342745, 'water_content'),
(0.01229791, 'cropping_system'),
(0.010053033, 'crop_residue'),
(0.00991174, 'grain_yield')],
0.4957264323895248),
([(0.022167865, 'water_content'),
(0.017181909, 'grain_yield'),
(0.012952353, 'conventional_tillage'),
(0.011155198, 'growing_season'),
(0.010262345, 'cover_crop'),
(0.007419842, 'cropping_system')],
0.48013462416707475),
([(0.022890551, 'microbial_biomass'),
(0.014957421, 'crop_residue'),
(0.01094401, 'aggregate_size'),
(0.010818942, 'conservation_tillage'),
(0.009582708, 'meta_analysis'),
(0.009033364, 'water_retention')],
0.4173767887534317),
([(0.041067652, 'cover_crop'),
(0.017838314, 'water_content'),
(0.0138873905, 'cropping_system'),
(0.0097843995, 'hairy_vetch'),
(0.009302901, 'water_retention'),
(0.009294609, 'conventional_tillage')],
0.4168424600808034),
([(0.049234726, 'cover_crop'),
(0.011948575, 'conventional_tillage'),
(0.011156568, 'microbial_biomass'),
(0.009945133, 'significant_difference'),
(0.008677175, 'growing_season'),
(0.0074653015, 'aggregate_stability')],
0.3853531630668887)]
model.print_topics()[(0,
'0.041*"cover_crop" + 0.018*"water_content" + 0.014*"cropping_system" + 0.010*"hairy_vetch" + 0.009*"water_retention" + 0.009*"conventional_tillage" + 0.009*"management_practice" + 0.009*"aggregate_stability" + 0.008*"crop_rotation" + 0.008*"crop_residue"'),
(1,
'0.022*"crop_residue" + 0.017*"cropping_system" + 0.016*"cover_crop" + 0.014*"crop_rotation" + 0.009*"microbial_biomass" + 0.009*"winter_wheat" + 0.009*"aggregate_size" + 0.009*"aggregate_stability" + 0.008*"conventional_tillage" + 0.007*"growing_season"'),
(2,
'0.041*"cover_crop" + 0.017*"conventional_tillage" + 0.013*"water_content" + 0.012*"cropping_system" + 0.010*"crop_residue" + 0.010*"grain_yield" + 0.009*"biochar_application" + 0.008*"water_retention" + 0.007*"growing_season" + 0.007*"conservation_tillage"'),
(3,
'0.049*"cover_crop" + 0.012*"conventional_tillage" + 0.011*"microbial_biomass" + 0.010*"significant_difference" + 0.009*"growing_season" + 0.007*"aggregate_stability" + 0.007*"cropping_system" + 0.007*"crop_rotation" + 0.005*"infiltration_rate" + 0.005*"sewage_sludge"'),
(4,
'0.022*"water_content" + 0.017*"grain_yield" + 0.013*"conventional_tillage" + 0.011*"growing_season" + 0.010*"cover_crop" + 0.007*"cropping_system" + 0.007*"crop_residue" + 0.007*"microbial_biomass" + 0.006*"management_practice" + 0.006*"moisture_content"'),
(5,
'0.023*"microbial_biomass" + 0.015*"crop_residue" + 0.011*"aggregate_size" + 0.011*"conservation_tillage" + 0.010*"meta_analysis" + 0.009*"water_retention" + 0.008*"infiltration_rate" + 0.008*"aggregate_stability" + 0.008*"cover_crop" + 0.007*"water_content"')]# show interactive vizualisation
pyLDAvis.disable_notebook() # comment to show the interactive in the notebook
# https://nbviewer.org/github/bmabey/pyLDAvis/blob/master/notebooks/pyLDAvis_overview.ipynb#topic=0&lambda=1&term=
out = gensimvis.prepare(model, corpus, dictionary)
outPreparedData(topic_coordinates= x y topics cluster Freq
topic
5 -0.034185 -0.003713 1 1 19.673994
4 -0.003522 0.022248 2 1 17.970774
3 0.017644 -0.016386 3 1 17.386206
2 0.010941 0.017702 4 1 15.614775
0 0.018621 -0.005039 5 1 15.096809
1 -0.009500 -0.014812 6 1 14.257442, topic_info= Term Freq Total Category logprob \
288 cover_crop 9454.000000 9454.000000 Default 30.0000
92 crop_residue 3848.000000 3848.000000 Default 29.0000
1574 hairy_vetch 844.000000 844.000000 Default 28.0000
61 water_content 4272.000000 4272.000000 Default 27.0000
388 grain_yield 2583.000000 2583.000000 Default 26.0000
... ... ... ... ... ...
497 microbial_community 197.300063 1224.686077 Topic6 -5.5428
363 sample_collected 188.884269 1119.032137 Topic6 -5.5864
182 significantly_higher 191.664251 1278.639230 Topic6 -5.5718
22 infiltration_rate 197.247244 1550.962068 Topic6 -5.5431
874 significant_difference 187.586777 1438.375566 Topic6 -5.5933
loglift
288 30.0000
92 29.0000
1574 28.0000
61 27.0000
388 26.0000
... ...
497 0.1222
363 0.1688
182 0.0501
22 -0.1143
874 -0.0891
[425 rows x 6 columns], token_table= Topic Freq Term
term
726 1 0.112533 aboveground_biomass
726 2 0.231956 aboveground_biomass
726 3 0.172244 aboveground_biomass
726 4 0.166503 aboveground_biomass
726 5 0.246884 aboveground_biomass
... ... ... ...
894 2 0.334950 field_capacity
894 3 0.097796 field_capacity
894 4 0.251824 field_capacity
894 5 0.139359 field_capacity
894 6 0.046453 field_capacity
[1638 rows x 3 columns], R=30, lambda_step=0.01, plot_opts={'xlab': 'PC1', 'ylab': 'PC2'}, topic_order=[6, 5, 4, 3, 1, 2])out.topic_coordinates# figure similar to Padarian and LDAvis
fig = plt.figure(figsize=(12, 6))
# topic on pca axes
df = out.topic_coordinates
ax = plt.subplot2grid((num_topics//2, 4), (0, 0), rowspan=num_topics//2, colspan=2)
ax.spines['right'].set_position('zero')
ax.spines['top'].set_position('zero')
ax.spines['left'].set_color('none')
ax.spines['bottom'].set_color('none')
ax.spines['right'].set_color('lightgrey')
ax.spines['top'].set_color('lightgrey')
ax.set_xticks([])
ax.set_yticks([])
scatter = ax.scatter(df['x'], df['y'], s=df['Freq']*100, alpha=0.5)
for i in range(df.shape[0]):
ax.text(df.loc[i, 'x'], df.loc[i, 'y'], str(df.loc[i, 'topics']), ha='center', va='center')
# produce a legend with a cross section of sizes from the scatter
handles, labels = scatter.legend_elements(prop="sizes", num=1, alpha=0.3, fmt='{x:.0f}%', func=lambda x: x/100)
legend2 = ax.legend(handles, labels, title="Marginal topic frequency")
ax.set_xlabel('PC 1')
ax.set_ylabel('PC 2')
ax.axhline(0, color='lightgrey')
ax.axvline(0, color='lightgrey')
a = 0.05
ax.set_xlim([-a, a])
ax.set_ylim([-a, a])
# word in topic
df = out.topic_info
topn = 6
xlim = [0, None]
for i in range(num_topics):
category = 'Topic' + str(i+1)
tdf = df[df['Category'].eq(category)].sort_values('Freq', ascending=False).reset_index(drop=False)
ax = plt.subplot2grid((num_topics//2, 4), (i%3, 2 + i//3))
ax.set_title('Topic {:d} (C$_V$={:.2f})'.format(i+1, top_topics[i][1]))
ax.barh(np.arange(topn), tdf['Total'].values[:topn])
ax.barh(np.arange(topn), tdf['Freq'].values[:topn])
terms = tdf['Term'].str.replace('_', ' ').values[:topn].tolist()
ax.set_yticks(np.arange(len(terms)))
ax.set_yticklabels(terms)
ax.set_xlim(xlim)
ax.invert_yaxis()
ax.set_xlabel('Term frequency')
fig.tight_layout()
fig.savefig(outputdir + 'topics-meta.jpg', dpi=300)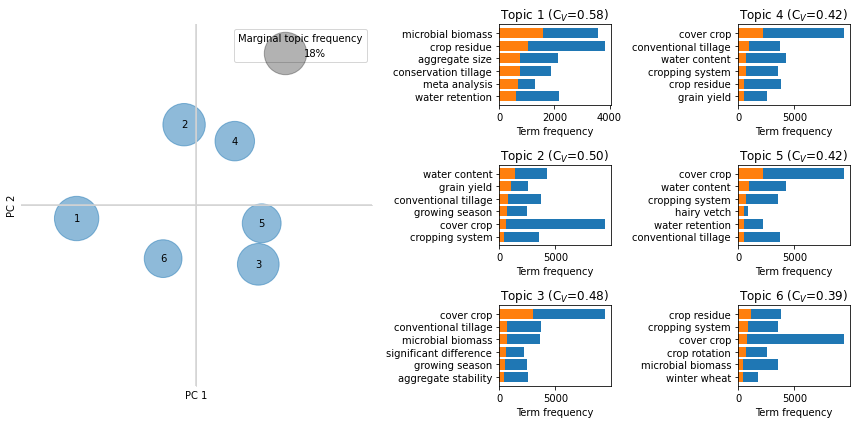
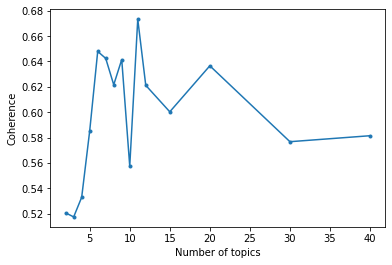
# try multiple number of topics
avgcoh = []
for num_topics in tqdm([2, 3, 4, 5, 6, 7, 8, 9, 10, 11, 12, 15, 20, 30, 40]):
    print('modelling {:d} topics'.format(num_topics))
    model = LdaMulticore(
        workers=4,
        corpus=corpus,
        id2word=id2word,
        chunksize=1000,
        #alpha='auto',
        eta='auto',
        iterations=100,
        num_topics=num_topics,
        passes=10,
        eval_every=None  # don't evaluate model perplexity, takes too much time.
    )

   # top_topics = model.top_topics(corpus=corpus, coherence='u_mass', topn=5)
    top_topics = model.top_topics(texts=docs, coherence='c_v', dictionary=dictionary, topn=5)
    coherences = [t[1] for t in top_topics]
    avgcoh.append([num_topics,
                   np.mean(coherences),
np.std(coherences)/np.sqrt(len(coherences))])# figure
avgcoh = np.array(avgcoh)
fig, ax = plt.subplots()
ax.errorbar(avgcoh[:, 0], avgcoh[:, 1],# yerr=avgcoh[:, 2],
marker='.', linestyle='-')
ax.set_xlabel('Number of topics')
ax.set_ylabel('Coherence')
fig.savefig(outputdir + 'coherence-meta.jpg', dpi=300)C:\Users\gblanchy\WPy64-3890\python-3.8.9.amd64\lib\site-packages\ipykernel\ipkernel.py:283: DeprecationWarning: `should_run_async` will not call `transform_cell` automatically in the future. Please pass the result to `transformed_cell` argument and any exception that happen during thetransform in `preprocessing_exc_tuple` in IPython 7.17 and above.
and should_run_async(code)
Detecting relationships
By looking at sentence that contains a 'driver' and a 'property', we try to find the relationship between the two.
Replacing abbreviation and detecting coreference
Coreference consists in replace a pronoun with the entity it is refering to. In the case observed in the abstract, we did not found it to be useful.
# replace abbreviation
def replaceAbbreviation(text):
    if pd.isna(text) is False:
        abrvs = [a for a in re.findall(r'(\([A-Z]*\))', text) if len(a) > 3]
        for abrv in abrvs:
            meaning = ' '.join(re.split(' |\\n', text.split(abrv)[0])[-(len(abrv)-1):])
            text = text.replace(abrv, '')
            text = text.replace(abrv[1:-1], meaning)
    return text


replaceAbbreviation('the soil organic carbon (SOC) is generally well used. SOC is dependent on ')
dfpub['abstract'] = dfpub['abstract'].apply(replaceAbbreviation)
dfpub['abstract-web'] = dfpub['abstract-web'].apply(replaceAbbreviation)
# replacing et al. by et al (without dots) to prevent it being as sentence period
def replaceEtAl(text):
if pd.isna(text) is False:
return text.replace('et al.', 'et al')
dfpub['abstract'] = dfpub['abstract'].apply(replaceEtAl)
dfpub['abstract-web'] = dfpub['abstract-web'].apply(replaceEtAl)Example
# example for paper
text = "In the short term, tillage operations significantly increased K"# for the entire range of pressure head applied."
sent = nlp(text)
displacy.render(sent, style='dep', options={'compact': True, 'distance': 90})# build dependency graph and show shortest dependency path
fig, ax = plt.subplots()
node_size = 1500
# find shortest dependency path (SDP)
edges = []
for token in sent:
for child in token.children:
edges.append((token.i, child.i))
G = nx.Graph(edges)
sdp = nx.shortest_path(G,
source=5,
target=9)
# draw network
pos = nx.spring_layout(G)
nx.draw_networkx_edges(G, pos, ax=ax, alpha=0.5)
nx.draw_networkx_nodes(G, pos, alpha=1, ax=ax, node_color='orange', node_size=node_size)
nx.draw_networkx_labels(G, pos, labels=dict(zip(np.arange(len(sent)), [a for a in sent])),
font_family="sans-serif", ax=ax, font_size=12)
# draw sdp
path_edges = list(zip(sdp, sdp[1:]))
nx.draw_networkx_nodes(G, pos, nodelist=sdp[:1], node_color='lightblue', node_size=node_size)
nx.draw_networkx_nodes(G, pos, nodelist=sdp[-1:], node_color='lime', node_size=node_size)
nx.draw_networkx_edges(G, pos, edgelist=path_edges, edge_color='r', width=5)
plt.axis("off")
ax.set_xlim([-1.2, 1.2])
ax.set_ylim([-1.2, 1.2])
fig.tight_layout()
fig.savefig(outputdir + 'sdp.jpg', dpi=300)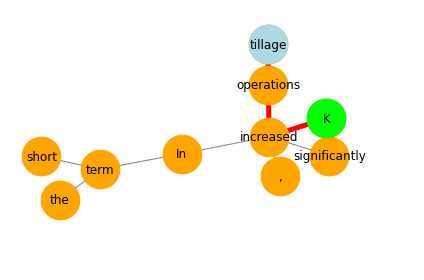
Identifying relevant sentences
Namely, a sentence which contains a relationships between a 'driver' and a 'property'.
# identify drivers and practices (could make this more complex by using the mural's keywords)
drivers = ['tillage', 'cover crop', 'catch crop', 'residue', 'fertilizer', 'manure', 'liming',
           'compost', 'traffic', 'compaction', 'biochar', 'irrigation', 'intercropping', 'agroforestry']
variables = [
    'hydraulic conductivity', 'water retention', 'available water', 'runoff',
    'infiltration', 'bulk density', 'macroporosity', 'penetration resistance',
    'soil strength', 'aggregate stability', 'aggregation', 'yield', 'organic matter',
    'organic carbon', 'microbial activity', 'microbial biomass', 'faunal activity',
    'faunal biomass', 'earthworm biomass', 'earthworm activity', 'root biomass',
    'root depth', 'root growth',
    # below are added from abstracts (so in in original search query)
    'rainwater penetration', 'K', 'Ks', 'K(h)', 'K0', 'infiltration rate'
]
# building patterns
driverMatcher = PhraseMatcher(nlp.vocab, attr='LEMMA')
for driver in drivers:
driverMatcher.add(camelCase(driver), [nlp(driver)])
variableMatcher = PhraseMatcher(nlp.vocab, attr='LEMMA')
for variable in variables:
variableMatcher.add(camelCase(variable), [nlp(variable)])
patterns = [
[
{'POS': 'AUX', 'OP': '+'},
{'POS': 'ADV', 'OP': '?'},
{'POS': 'ADJ', 'OP': '*'}],
[
{'POS': 'VERB', 'OP': '+'},
{'POS': 'ADV', 'OP': '?'},
{'POS': 'ADJ', 'OP': '?'},
{'POS': 'NOUN', 'OP': '?'}],
]
verbMatcher = Matcher(nlp.vocab)
verbMatcher.add('be have', patterns)# look for sentence with the two keywords
dfmatch = pd.DataFrame(columns=['pubid', 'driver', 'variable', 'sentence',
'driverChunk', 'driverVerb', 'variableChunk',
'variableVerb', 'negation', 'sdp', 'relationship'])
for i, abstract in tqdm(enumerate(dfpub['abstract-web']), total=dfpub.shape[0], leave=True):
if pd.isna(abstract) is False:
doc = nlp(abstract)
# looking for sentence containing driver and variable
for sent in doc.sents:
driverMatches = []
variableMatches = []
# looking inside each name chunk for keywords
for chunk in sent.noun_chunks:
matches = driverMatcher(chunk)
if len(matches) > 0:
driverMatches.append(
(nlp.vocab.strings[matches[0][0]], chunk))
matches = variableMatcher(chunk)
if len(matches) > 0:
variableMatches.append(
(nlp.vocab.strings[matches[0][0]], chunk))
# check if negation
negs = [token for token in sent if token.dep_ == 'neg']
if len(driverMatches) > 0 and len(variableMatches) > 0:
# building relationship between drivers and variables found
for driverMatch in driverMatches:
for variableMatch in variableMatches:
# attempting to get the verb linking the two chunk
# in a recursive way
if driverMatch[1].root.head.pos_ == 'VERB':
verb1 = driverMatch[1].root.head.text
elif driverMatch[1].root.head.head.pos_ == 'VERB':
verb1 = driverMatch[1].root.head.head.text
elif driverMatch[1].root.head.head.head.pos_ == 'VERB':
verb1 = driverMatch[1].root.head.head.head.text
elif driverMatch[1].root.head.head.head.head.pos_ == 'VERB':
verb1 = driverMatch[1].root.head.head.head.head.text
else:
verb2 = None
if variableMatch[1].root.head.pos_ == 'VERB':
verb2 = variableMatch[1].root.head.text
elif variableMatch[1].root.head.head.pos_ == 'VERB':
verb2 = variableMatch[1].root.head.head.text
elif variableMatch[1].root.head.head.head.pos_ == 'VERB':
verb2 = variableMatch[1].root.head.head.head.text
elif variableMatch[1].root.head.head.head.head.pos_ == 'VERB':
verb2 = variableMatch[1].root.head.head.head.head.text
else:
verb2 = None
# find shortest dependency path (SDP)
edges = []
for token in sent:
for child in token.children:
edges.append((token.i, child.i))
graph = nx.Graph(edges)
sdp = nx.shortest_path(graph,
source=driverMatch[1].root.i,
target=variableMatch[1].root.i)
i2t = dict(zip([token.i for token in sent],
[token for token in sent]))
#sdpVerb = [i2t[a].lower_ for a in sdp if i2t[a].pos_ == 'VERB']
# replace driver, variable and verb by more informative chunks
sdpPath = ', '.join([i2t[a].lower_ for a in sdp])
sdpPath = sdpPath.replace(driverMatch[1].root.text,
driverMatch[1].text.lower())
sdpPath = sdpPath.replace(variableMatch[1].root.text,
variableMatch[1].text.lower())
verbMatches = verbMatcher(sent)
verbSpans = [sent[start:end] for _, start, end in verbMatches]
sdpVerb = ''
sdpVerbLong = ''
for a in sdp:
token = i2t[a]
if (token.pos_ == 'AUX') | (token.pos_ == 'VERB'):
sdpVerb = token.text
sdpVerbLong = token.text
for verbSpan in verbSpans:
if ((token in verbSpan)
& (len(sdpVerbLong) < len(verbSpan.text))):
sdpVerbLong = verbSpan.text
sdpPath = sdpPath.replace(sdpVerb, sdpVerbLong)
dic = {
'pubid': i,
'driver': driverMatch[0],
'variable': variableMatch[0],
'sentence': sent.text.strip().replace('\n',' '),
'driverChunk': driverMatch[1].text.strip().replace('\n', ' '),
'driverVerb': verb1,
'variableChunk': variableMatch[1].text.strip().replace('\n', ' '),
'variableVerb': verb2,
'sdp': sdpPath,
#'sdp_old': ', '.join([i2t[a].lower_ for a in sdp]),
'sdpVerb': sdpVerbLong,
'negation': True if len(negs) % 2 != 0 else False,
}
dfmatch = dfmatch.append(dic, ignore_index=True)
# drop duplicates
print(dfmatch.shape, '-> ', end='')
dfmatch = dfmatch.drop_duplicates().reset_index(drop=True)
print(dfmatch.shape, 'after duplicates drop')
print('{:d} relationship detected (among {:d} documents)'.format(
dfmatch.shape[0], dfpub.shape[0]))
dfmatch.sort_values('sentence').to_excel(datadir + 'dfmatch-web.xlsx', index=False)Assessing the correlation of relationships
Possible sentiments:
- +1: the two entities are positively correlated, when the driver increases, the property increases (e.g. biochar incrases hydraulic conductivity)
- -1: the two entities are negativaly correlated, when the driver increases, the property decreases (e.g. reduced tillage increase soil hydraulic conductivity)
- 0: there is not effect, neither positive or negative (e.g. the application of biochar had no significant effect on soil hydraulic conductivity)
- 2: has been studied but no conclusion (e.g. the effect of biochar on soil hydraulic conductivity were investigated)
- NA: not relevant, unclassified
# load dataframe with manually assessed sentence
dfmatch = pd.read_excel(datadir + 'dfmatch-web-labels.xlsx')
# drivers and predictors
fig, ax = plt.subplots()
dfmatch['driver'].value_counts().plot(kind='bar', ax=ax)
ax.set_ylabel('Count')
ax.set_xlabel('Drivers');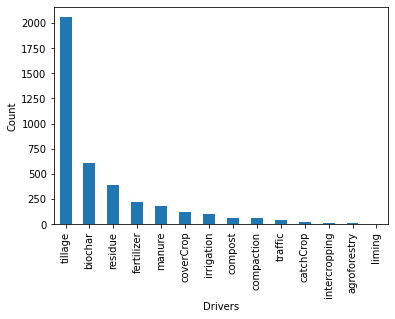
# show number of sentences identified
dft = dfmatch[['driver', 'variable']].copy()
dft['one'] = 1
dft = dft.pivot_table(values='one', columns='driver', index='variable', aggfunc=np.sum, fill_value=0)
dft = dft.replace(0, np.nan)
fig, ax = plt.subplots()
cax = ax.imshow(dft.values.T, vmax=50)
ax.set_yticks(np.arange(dft.shape[1]))
ax.set_yticklabels(dft.columns)
ax.set_ylabel('Drivers')
ax.set_xticks(np.arange(dft.shape[0]))
ax.set_xticklabels(dft.index, rotation=90)
ax.set_xlabel('Variables')
fig.colorbar(cax, ax=ax, label='Count')
fig.tight_layout()
fig.savefig(outputdir + 'rel-identified-meta.jpg', dpi=300)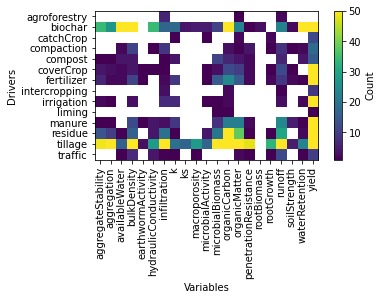
# matcher for sentiments
posVerb = ['enhance', 'increase', 'improve', 'mitigate',
           'have significant increase', 'have significant effect',
           'have greater effect', 'be higher', 'can make a valuable contribution']
negVerb = ['decrease', 'reduce', 'prevent', 'be lower',
           'have significant decrease']
neuVerb = ['have no effect', 'have no signficant effect', 'have minimal effect',
           'be relatively small', 'whatever', 'affect']
posMatcher = PhraseMatcher(nlp.vocab, attr='LEMMA')
for a in posVerb:
    posMatcher.add(camelCase(a), [nlp(a)])
negMatcher = PhraseMatcher(nlp.vocab, attr='LEMMA')
for a in negVerb:
    negMatcher.add(camelCase(a), [nlp(a)])
neuMatcher = PhraseMatcher(nlp.vocab, attr='LEMMA')
for a in neuVerb:
    neuMatcher.add(camelCase(a), [nlp(a)])

studyWords = ['study', 'analyzed', 'analysed', 'measured', 'hypothesize', 'determine',
              'assessed', 'reported', 'be done', 'be conducted', 'quantify', 'compare']
studyMatcher = PhraseMatcher(nlp.vocab, attr='LEMMA')
studyMatcher.add('study', [nlp(a) for a in studyWords])
studyWords2 = ['objective', 'purpose', 'study']
studyMatcher2 = PhraseMatcher(nlp.vocab, attr='LEMMA')
studyMatcher2.add('study', [nlp(a) for a in studyWords2])

# was higher (be + modifiers), had a greater effect
# had higher hydraulic conductivity, lower, decreasing of, improvement in
# assessing sentiment on shortest dependency path (sdp)
dfmatch['sdpRel'] = np.nan
modifiers = ['less', 'conservation', 'no-', 'no', '(non-inversion)', 'non-inversion',
'reduced', 'minimum', 'decreasing of', 'decreasing in']
for i, sdp in tqdm(enumerate(dfmatch['sdp']), total=dfmatch.shape[0]):
# identify modifier
a = 1
driverChunk = dfmatch.loc[i, 'driverChunk']
if pd.Series(driverChunk.split(' ')).isin(modifiers).sum() > 0:
a = -1
b = 1
variableChunk = dfmatch.loc[i, 'variableChunk']
if pd.Series(variableChunk.split(' ')).isin(modifiers).sum() > 0:
b = -1
c = 1
if dfmatch.loc[i, 'negation'] == True:
c = -1
if len(posMatcher(nlp(sdp))) > 0:
dfmatch.loc[i, 'sdpRel'] = 1 * a * b * c
elif len(negMatcher(nlp(sdp))) > 0:
dfmatch.loc[i, 'sdpRel'] = -1.0 * a * b * c
elif len(neuMatcher(nlp(sdp))) > 0:
dfmatch.loc[i, 'sdpRel'] = 0.0
elif len(studyMatcher(nlp(sdp))) > 0:
dfmatch.loc[i, 'sdpRel'] = 2.0
else:
# these lines below add quite a bit of relationships
if len(studyMatcher(nlp(dfmatch.loc[i, 'sentence']))) > 0:
dfmatch.loc[i, 'sdpRel'] = 2.0
print('{:d}/{:d} relationship found'.format(
dfmatch['sdpRel'].notnull().sum(), dfmatch.shape[0]))
dfmatch.sort_values('sentence').to_excel(datadir + 'dfmatch-nlp.xlsx', index=False)# figure (double histogram with well identified and not well identified)
fig, axs = plt.subplots(1, 2, sharey=True, figsize=(8, 3))
cats = [-1, 0, 1, 2]
colors = {1: 'tab:orange', 0: 'lightgrey', -1: 'tab:blue', 2: 'tab:green'}
xlabs = ['negative', 'neutral', 'positive', 'study']
isub = dfmatch['relTrue'].isin(cats)
# recall
ax = axs[0]
ax.set_title('(a) Recall\n(how many relevant found from total)')
#ie = dfmatch['relationship'].isna() & dfmatch['relTrue'].isna()
#cax = ax.bar(-2, ie.sum())
#ax.bar(-2, dfmatch['relTrue'].isna().sum(), bottom=ie.sum(),
# alpha=0.5, color=cax.patches[0].get_facecolor())
scores = []
for cat in cats:
icommon = dfmatch[isub]['sdpRel'].eq(cat) & dfmatch[isub]['relTrue'].eq(cat)
irelevant = dfmatch[isub]['relTrue'].eq(cat)
scores.append(icommon.sum()/irelevant.sum())
cax = ax.bar(cat, icommon.sum(), color=colors[cat])
ax.bar(cat, irelevant.sum(),
alpha=0.5, color=cax.patches[0].get_facecolor())
ax.bar([], [], color='k', alpha=0.5, label='not found')
ax.bar([], [], color='k', alpha=1, label='found')
leg = ax.legend()
for lh, a in zip(leg.legendHandles, [0.5, 1]):
lh.set_alpha(a)
lh.set_color('green')
ax.set_xticks(cats)
ax.set_xticklabels([xlab + '\n{:.2f}'.format(a) for xlab, a in zip(xlabs, scores)])
ax.set_xlabel('Status')
ax.set_ylabel('Number of relationships')
ax = axs[1]
ax.set_title('(b) Precision\n(how many relevant among selected)')
#ie = dfmatch['relationship'].isna() & dfmatch['relTrue'].isna()
#cax = ax.bar(-2, ie.sum())
#ax.bar(-2, dfmatch['relTrue'].isna().sum(), bottom=ie.sum(),
# alpha=0.5, color=cax.patches[0].get_facecolor())
scores = []
for cat in cats:
icommon = dfmatch[isub]['sdpRel'].eq(cat) & dfmatch[isub]['relTrue'].eq(cat)
iselected = dfmatch[isub]['sdpRel'].eq(cat)
scores.append(icommon.sum()/iselected.sum())
cax = ax.bar(cat, icommon.sum(), color=colors[cat])
ax.bar(cat, iselected.sum(),
alpha=0.5, color=cax.patches[0].get_facecolor())
ax.bar([], [], color='k', alpha=0.5, label='not relevant')
ax.bar([], [], color='k', alpha=1, label='relevant')
leg = ax.legend()
for lh, a in zip(leg.legendHandles, [0.5, 1]):
lh.set_alpha(a)
lh.set_color('green')
ax.set_xticks(cats)
ax.set_xticklabels([xlab + '\n{:.2f}'.format(a) for xlab, a in zip(xlabs, scores)])
ax.set_xlabel('Status')
fig.tight_layout()
fig.savefig(outputdir + 'rel-score-bar-meta.jpg', dpi=500)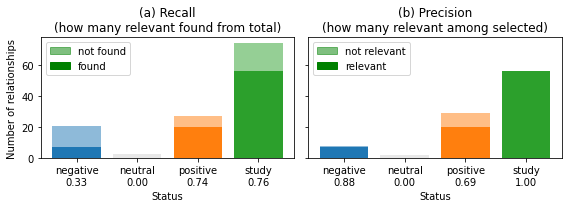
# figure with matrix relationship between drivers and properties

ie = dfmatch['relTrue'].notnull()  # all not NaN relationships

df = dfmatch[ie].copy().replace(-2, np.nan)
drivers = df['driver'].unique()
variables = df['variable'].unique()
colors = {1: 'tab:orange', 0: 'lightgrey', -1: 'tab:blue', 2: 'tab:green'}
r = 0.3 # could make the radius varies with the number of relationships found

# create legend (for sizes)

fig, axs = plt.subplots(1, 2, figsize=(10, 5), sharex=True, sharey=True)

ax = axs[0]
ax.set_title('(a) Manually labelled')
for i, driver in enumerate(drivers):
    for j, variable in enumerate(variables):
        ie = df['driver'].eq(driver) & df['variable'].eq(variable)
        s = df[ie]['relTrue'].value_counts()
        a = s.sum()
        sdict = (s/a).to_dict()  # in proportion
        if a < 5:
            r = 0.2
        elif a < 10:
            r = 0.3
        else:
            r = 0.5
        theta1 = 0
        for key in [1, 0, -1, 2]:
            if key in sdict:
                val = sdict[key]
                theta2 = theta1 + val*360
                ax.add_patch(mpatches.Wedge((j, i), r, theta1, theta2, ec='none',
                                            color=colors[key]))
                theta1 = theta2
ax.set_yticks(np.arange(len(drivers)))
ax.set_yticklabels(drivers)
ax.set_ylabel('Drivers')
ax.set_xticks(np.arange(len(variables)))
ax.set_xticklabels(variables, rotation=90)
ax.set_xlabel('Variables')
ax.set_aspect('equal')

ax = axs[1]
ax.set_title('(b) NLP recovered')
for i, driver in enumerate(drivers):
    for j, variable in enumerate(variables):
        ie = df['driver'].eq(driver) & df['variable'].eq(variable)
        s = df[ie]['sdpRel'].value_counts()
        a = s.sum()
        sdict = (s/a).to_dict()  # in proportion
        if a < 5:
            r = 0.2
        elif a < 10:
            r = 0.3
        else:
            r = 0.5
        theta1 = 0
        for key in [1, 0, -1, 2]:
            if key in sdict:
                val = sdict[key]
                theta2 = theta1 + val*360
                ax.add_patch(mpatches.Wedge((j, i), r, theta1, theta2, ec='none',
                                            color=colors[key]))
                theta1 = theta2
ax.set_xticks(np.arange(len(variables)))
ax.set_xticklabels(variables, rotation=90)
ax.set_xlabel('Variables')

# add legend
msizes = [0.2, 0.3, 0.5]
labels = ['1-4', '5-9', '>10']
markers = []
for i, size in enumerate(msizes):
    markers.append(plt.scatter([],[], s=size**2*1000, label=labels[i], color='k', alpha=0.5))
ax.add_artist(plt.legend(handles=markers, bbox_to_anchor=(1, 1), title='Nb statements', fontsize=12))

markers = []
markers.append(ax.add_patch(mpatches.Wedge((0,0), 0, 0, 360, color=colors[1], label='positive')))
markers.append(ax.add_patch(mpatches.Wedge((0,0), 0, 0, 360, color=colors[0], label='neutral')))
markers.append(ax.add_patch(mpatches.Wedge((0,0), 0, 0, 360, color=colors[-1], label='negative')))
markers.append(ax.add_patch(mpatches.Wedge((0,0), 0, 0, 360, color=colors[2], label='study')))
ax.legend(handles=markers, bbox_to_anchor=(1, 0.1), title='Relationship', fontsize=12)

ax.set_xlim([-0.5, len(variables)-0.5])
ax.set_ylim([-0.5, len(drivers)-0.5])
ax.set_aspect('equal')

fig.tight_layout()
fig.savefig(outputdir + 'rel-bubbles-meta.jpg', dpi=500)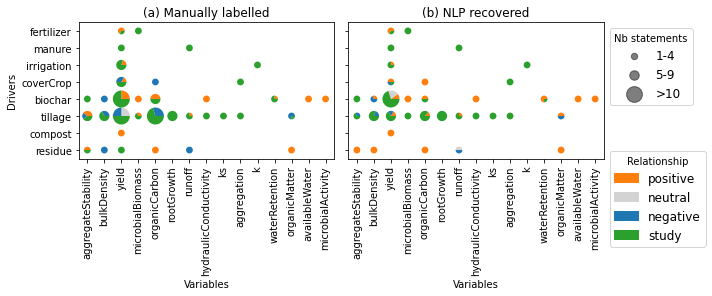
# scoring

# task 1: identification of relationships
# we would need to manually extract all relationship from abstract for this

# task 2: sentiment of relationships (match (+1/-1) or not (0))
#col = 'relationship'
col = 'sdpRel'
n = dfmatch.shape[0]
tp = (dfmatch[col].notnull() & dfmatch['relTrue'].notnull()).sum()
tn = (dfmatch[col].isna() & dfmatch['relTrue'].isna()).sum()
fp = (dfmatch[col].notnull() & dfmatch['relTrue'].isna()).sum()
fn = (dfmatch[col].isna() & dfmatch['relTrue'].notnull()).sum()
recall = tp / (tp + fn)
precision = tp / (tp + fp)
f1 = 2 * (recall * precision) / (recall + precision)
print('on selection of relevant relationships:')
print('recall: {:.2f}'.format(recall))
print('precision: {:.2f}'.format(precision))
print('f1 score: {:.2f}'.format(f1))

# task 3: correct assignement
ie = dfmatch['relTrue'].notnull() & dfmatch['relTrue'].ne(-2)
match = (dfmatch[ie][col] == dfmatch[ie]['relTrue']).sum()
print('correctly assigned: {:d}/{:d} ({:.0f}%)'.format(
    match, np.sum(ie), match/np.sum(ie)*100))
on selection of relevant relationships:
recall: 0.74
precision: 0.04
f1 score: 0.08
correctly assigned: 83/125 (66%)
# show mistakes
ie1 = dfmatch['relTrue'].isna() & dfmatch['sdpRel'].isna()
ie2 = dfmatch['relTrue'] != dfmatch['sdpRel']
ie2[ie1] = False  # nan != nan always true
dfmatch[ie2][['driver', 'variable', 'sentence', 'driverVerb', 'variableVerb', 'negation', 'sdp', 'sdpRel', 'relTrue']]- Röder, M., Both, A., & Hinneburg, A. (2015, February). Exploring the Space of Topic Coherence Measures. Proceedings of the Eighth ACM International Conference on Web Search and Data Mining. 10.1145/2684822.2685324